Contents

Go浅析-性能分析

[toc]

一、概述

Go 语言中,主要关注的程序运行情况包括以下几种:

  • CPU profile:报告程序的 CPU 使用情况,按照一定频率去采集应用程序在 CPU 和寄存器上面的数据;
  • Memory Profile(Heap Profile):报告程序的内存使用情况;
  • Block Profile:报告导致阻塞的同步原语的情况,可以用来分析和查找锁的性能瓶颈;
  • Goroutine Profile:报告 goroutines 的使用情况,有哪些 goroutine,它们的调用关系是怎样的。

benchmark(基准测试) 可以度量某个函数或方法的性能,也就是说,如果我们知道性能的瓶颈点在哪里,benchmark 是一个非常好的方式。但是面对一个未知的程序,如何去分析这个程序的性能,并找到瓶颈点呢?

pprof 就是用来解决这个问题的。pprof 包含两部分:

  • 编译到程序中的 runtime/pprof
  • 性能剖析工具 go tool pprof

针对不同场景,应采用不同的分析方法:

  • 工具类应用:执行完任务就结束退出。可以使用 runtime/pprof 库;
  • 服务型应用:应用需要一直运行,比如 web 应用或者gRPC服务。可以使用 net/http/pprof 库,能够在应用提供 HTTP 服务时进行分析。

二、性能分析类型

2.1 CPU 性能分析

CPU 性能分析(CPU profiling) 是最常见的性能分析类型。

主要思想一个函数在性能分析数据中出现的次数越多,说明执行该函数的代码路径(code path)花费的时间占总运行时间的比重越大。

主要原理:启动 CPU 分析时,运行时(runtime) 将每隔 10ms 中断一次,记录此时正在运行的协程(goroutines) 的堆栈信息。程序运行结束后,可以分析记录的数据找到最热代码路径(hottest code paths)。

2.2 内存性能分析

内存性能分析(Memory profiling) 记录堆内存分配时的堆栈信息,忽略栈内存分配信息。

内存性能分析启用时,默认每1000次采样1次,这个比例是可以调整的。因为内存性能分析是基于采样的,因此基于内存分析数据来判断程序所有的内存使用情况是很困难的。

2.3 阻塞性能分析

阻塞性能分析(block profiling) 是 Go 特有的。

阻塞性能分析用来记录一个协程等待一个共享资源花费的时间。在判断程序的并发瓶颈时会很有用。阻塞的场景包括:

  • 在没有缓冲区的信道上发送或接收数据。
  • 从空的信道上接收数据,或发送数据到满的信道上。
  • 尝试获得一个已经被其他协程锁住的排它锁。

一般情况下,当所有的 CPU 和内存瓶颈解决后,才会考虑这一类分析。

2.4 锁性能分析

锁性能分析(mutex profiling) 与阻塞分析类似,但专注于因为锁竞争导致的等待或延时

三、CPU 性能分析

记录性能数据会对程序的性能产生影响,建议一次只记录一类数据。

3.1 生成 profile

Go 的运行时性能分析接口都位于 runtime/pprof 包中。只需要调用 runtime/pprof 库即可得到我们想要的数据。

假设我们实现了这么一个程序,随机生成了 5 组数据,并且使用冒泡排序法排序。

 1
 2
 3
 4
 5
 6
 7
 8
 9
10
11
12
13
14
15
16
17
18
func generate(n int) []int {
	rand.Seed(time.Now().UnixNano())
	nums := make([]int, n)
	for i := 0; i < len(nums); i++ {
		nums[i] = rand.Int() % 1000
	}
	return nums
}

func bubbleSort(nums []int) {
	for i := 0; i < len(nums); i++ {
		for j := i + 1; j < len(nums); j++ {
			if nums[i] > nums[j] {
				nums[i], nums[j] = nums[j], nums[i]
			}
		}
	}
}

如果我们想度量这个应用程序的 CPU 性能数据,只需要在 main 函数中添加几行代码即可:

 1
 2
 3
 4
 5
 6
 7
 8
 9
10
11
12
func main() {
	f, _ := os.OpenFile("cpu.pprof", os.O_CREATE|os.O_RDWR, 0644)
	defer f.Close()
	pprof.StartCPUProfile(f)
	defer pprof.StopCPUProfile()
	n := 10
	for i := 0; i < 5; i++ {
		nums := generate(n)
		bubbleSort(nums)
		n *= 10
	}
}

3.2 数据分析

1
2
3
go run 01-cpu.go
# 用 web 的方式查看
go tool pprof -http=:9999 cpu.pprof

然后访问:localhost/:9999 即可。

image-20230523143953590
1
2
# 在命令行中查看
go tool pprof cpu.pprof
 1
 2
 3
 4
 5
 6
 7
 8
 9
10
11
12
❯ go tool pprof cpu.pprof
Type: cpu
Time: May 23, 2023 at 2:36pm (CST)
Duration: 2.30s, Total samples = 1.33s (57.87%)
Entering interactive mode (type "help" for commands, "o" for options)
(pprof) top
Showing nodes accounting for 1.33s, 100% of 1.33s total
      flat  flat%   sum%        cum   cum%
     1.33s   100%   100%      1.33s   100%  main.bubbleSort (inline)
         0     0%   100%      1.33s   100%  main.main
         0     0%   100%      1.33s   100%  runtime.main
(pprof)

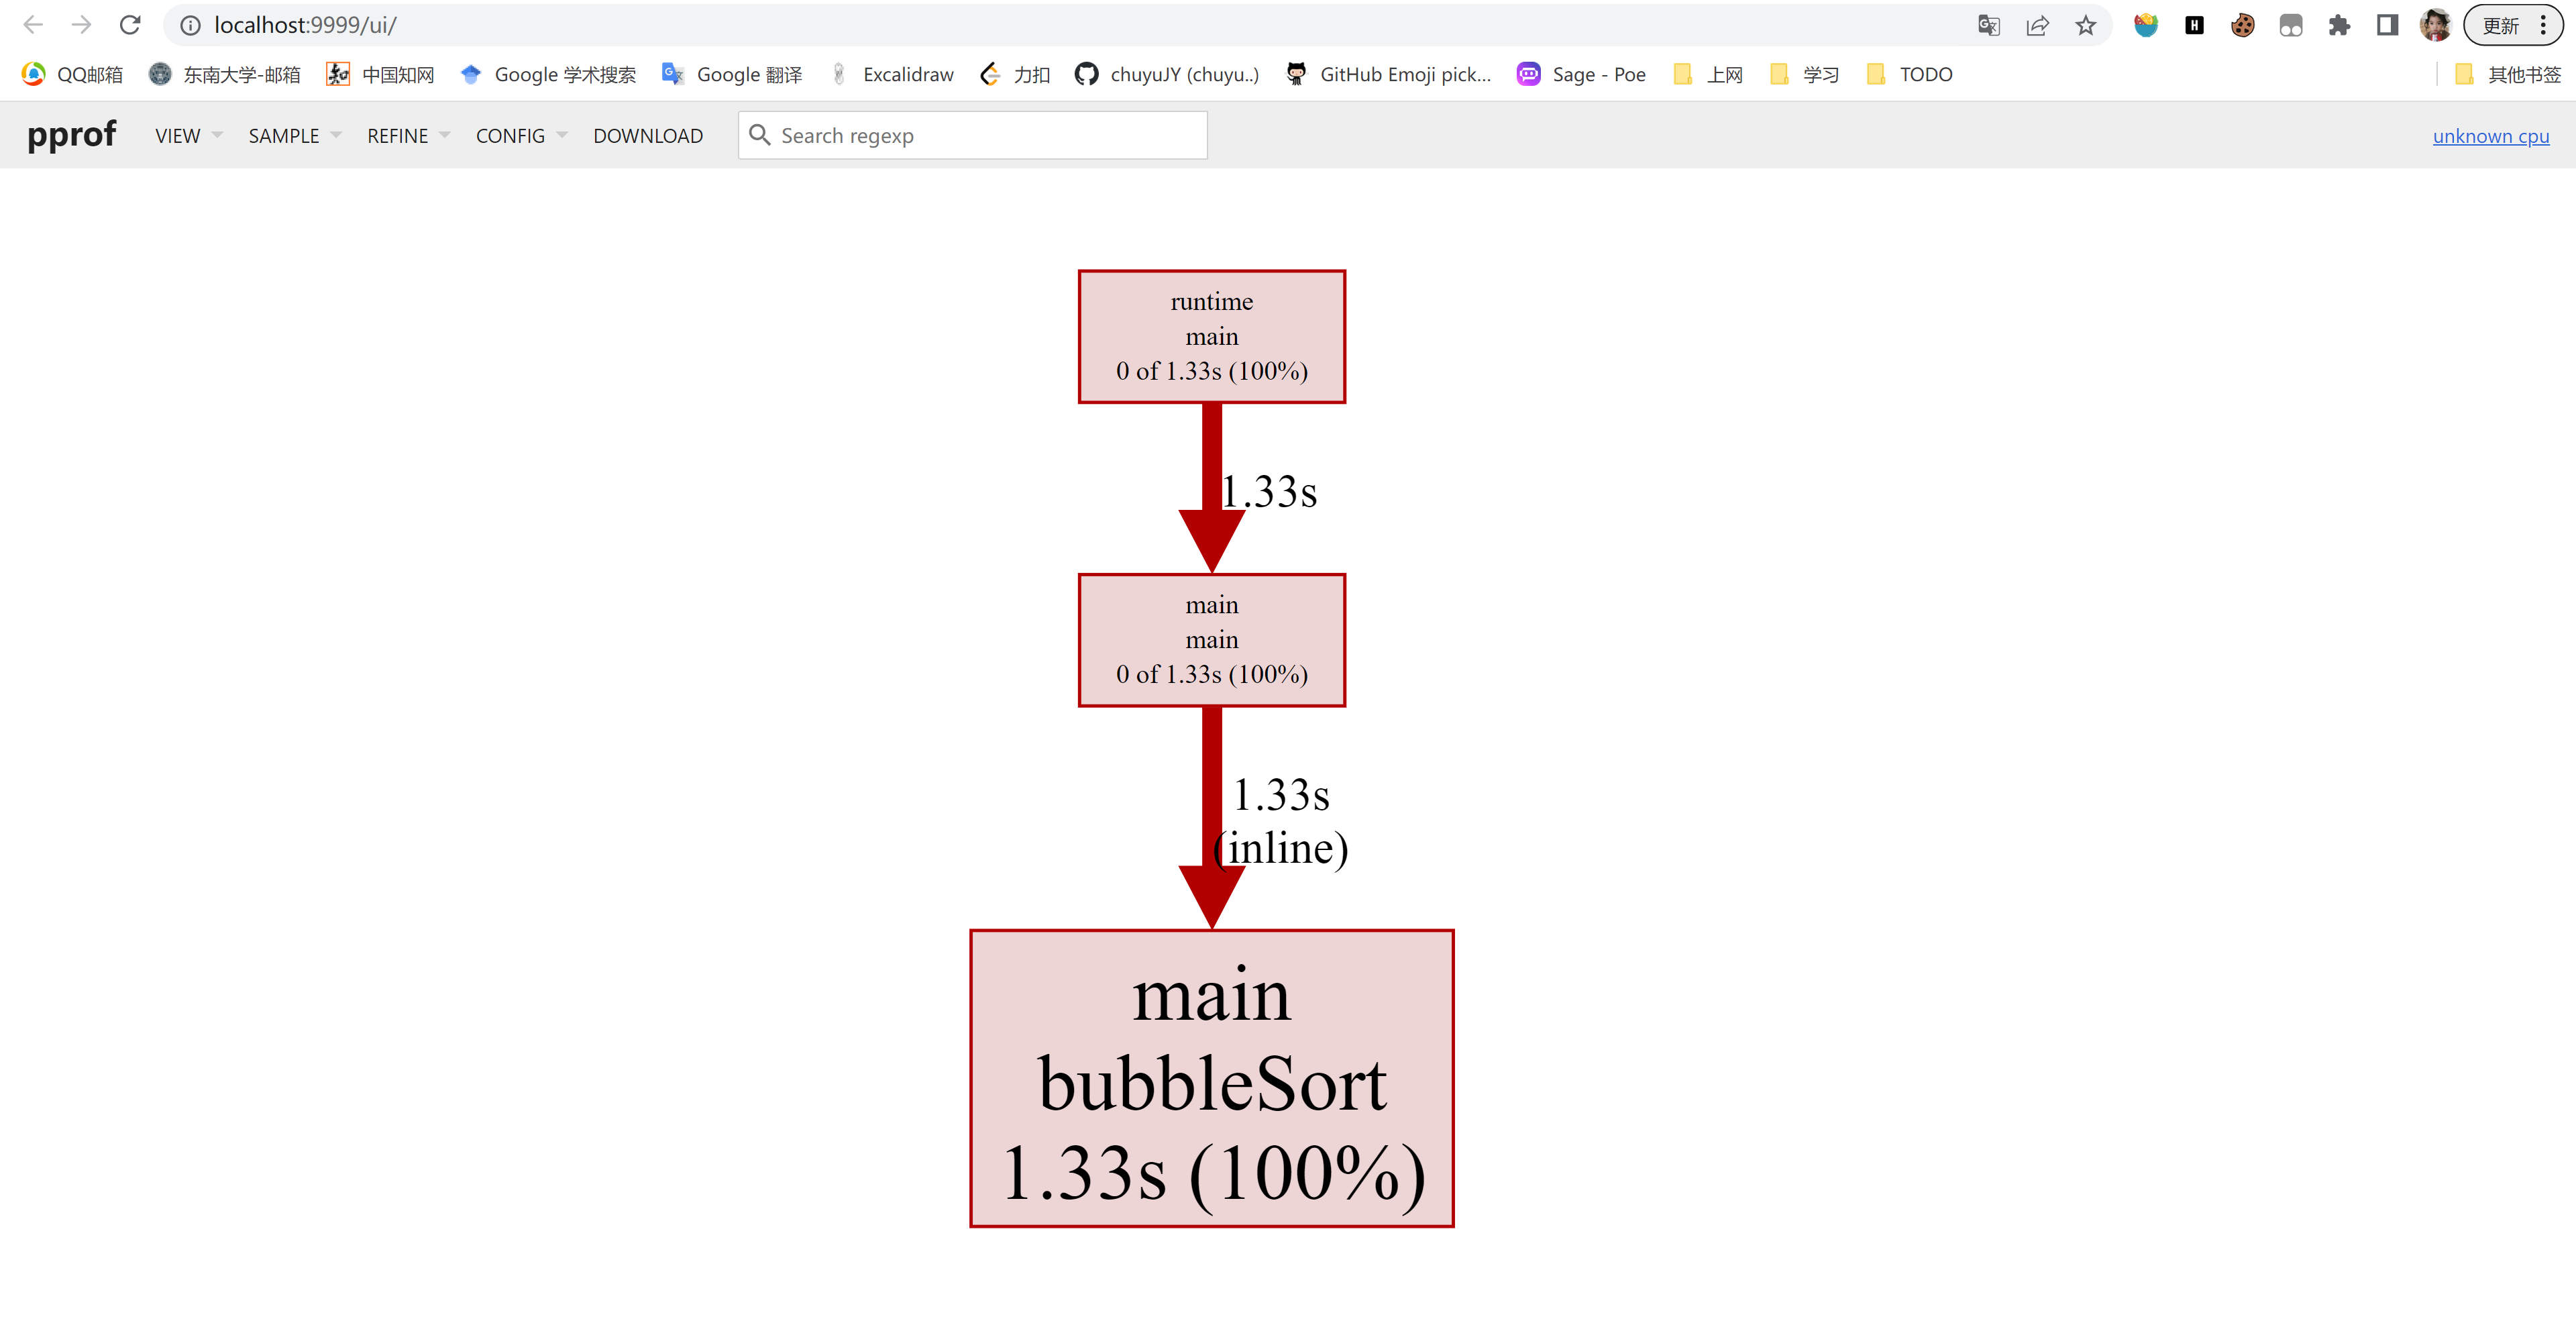
可以看到 main.bubbleSort 是消耗 CPU 最多的函数。

还可以按照 cum (累计消耗)排序。通过 help 查看所有的命令。

四、内存性能分析

4.1 生成 profile

假设我们实现了这么一个程序,生成长度为 N 的随机字符串,拼接在一起。

使用一个易用性更强的库 pkg/profile 来采集性能数据,pkg/profile 封装了 runtime/pprof 的接口,使用起来更简单。

 1
 2
 3
 4
 5
 6
 7
 8
 9
10
11
12
13
14
15
16
17
18
19
20
21
22
23
24
25
26
27
28
29
30
31
package main

import (
	"github.com/pkg/profile"
	"math/rand"
)

const letterBytes = "abcdefghijklmnopqrstuvwxyzABCDEFGHIJKLMNOPQRSTUVWXYZ"

func randomString(n int) string {
	b := make([]byte, n)
	for i := range b {
		b[i] = letterBytes[rand.Intn(len(letterBytes))]
	}
	return string(b)
}

func concat(n int) string {
	s := ""
	for i := 0; i < n; i++ {
		s += randomString(n)
	}
	return s
}

func main() {
    // 不太好用啊,Windows上生成的路径很烦。。。建议还是不在 Windows 上用。。。
	// defer profile.Start(profile.MemProfile, profile.MemProfileRate(1)).Stop()
	
	concat(100)
}

参考文章: